 |
|
|||||||||||
|
|
|
|||||||||||||||||||||||||||
ChemSep FeaturesColumn Simulations Made EasyWhether used stand-alone or embedded in a flowsheet, ChemSep provides you with a robust column simulator that does not require you to supply initial guesses. Our intuitive interface runs within all CAPE-OPEN compliant commercial process design software allowing a wide variety of column configurations and specifications. The easy to use interface enables you to solve your separations problems in minutes. Models Actual Column PerformanceChemSep is a column simulator for distillation, absorption, and extraction operations. Choose the classic equilibrium stage column model and then switch to the nonequilibrium (rate-based) model for more accurate descriptions of actual column performance. ChemSep has its own libraries with an extensive set of capacity and mass transfer performance parameters for trays and packings. Together with the thermodynamic and physical property packages ChemSep offers a wide range of applications is covered. 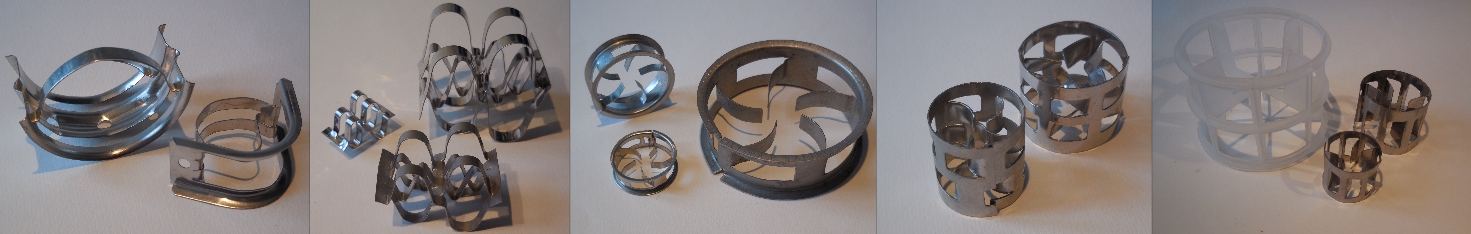
Quick EngineeringInspect the results of your column configuration instantaneously with predefined plots so that you can engineer the best line-up using rigorous simulations. Quickly find the specifications that deliver optimal column performance and use vendor tools to match capacity and required packed bed or trays to obtain the most economical solution. ChemSep can then directly export to requisition data sheets. Industrial Strength SolverChemSep has been tested with many industrial columns such as demethanizers, debutanizers, refluxed absorbers, azeotropic and extractive distillation; all solve robustly without requiring the user to provide any initial guesses. Computation speed remains high even when including tens or hundreds of compounds. An extensive set of examples is available online. Versatile and CustomizableEngineers do not have to worry about units conversions; they are built-in. Results can be exported into a range of formats including a spreadsheet layout that the you can design. Graphs can be stored and re-applied to each new simulation. Populate your toolbar with your favourite actions. Comprehensive and In-depth ModellingSimulate columns by means of efficiencies, or better, by means of detailed rate-based models for trays and packings to compute actual column performance. With ChemSep's design mode the simulator runs automatically and column diameters are set by means of the specified fraction of flood. ChemSep has a large database with validated model parameters for all standard column internals including modern high capacity packings from Sulzer, Koch-Glitsch, Montz, and Raschig. Test Drive for FreeTest-drive the equilibrium column model and convince yourself with the free ChemSep LITE with up to 40 components and 300 equilibrium stages using a database covering 400+ chemicals. Run ChemSep standalone or inside a flowsheet simulator. Copyright © Tue Mar 24 22:59:13 2020 ChemSep |
|||||
|
|
|||||